Real-Time Sensor Data Visualization
As part of the conference "Visualizing Knowledge 2018" at the Aalto University in Helsinki, Joël Gähwiler gave a workshop on the topic of "Real-Time Sensor Data Visualization".
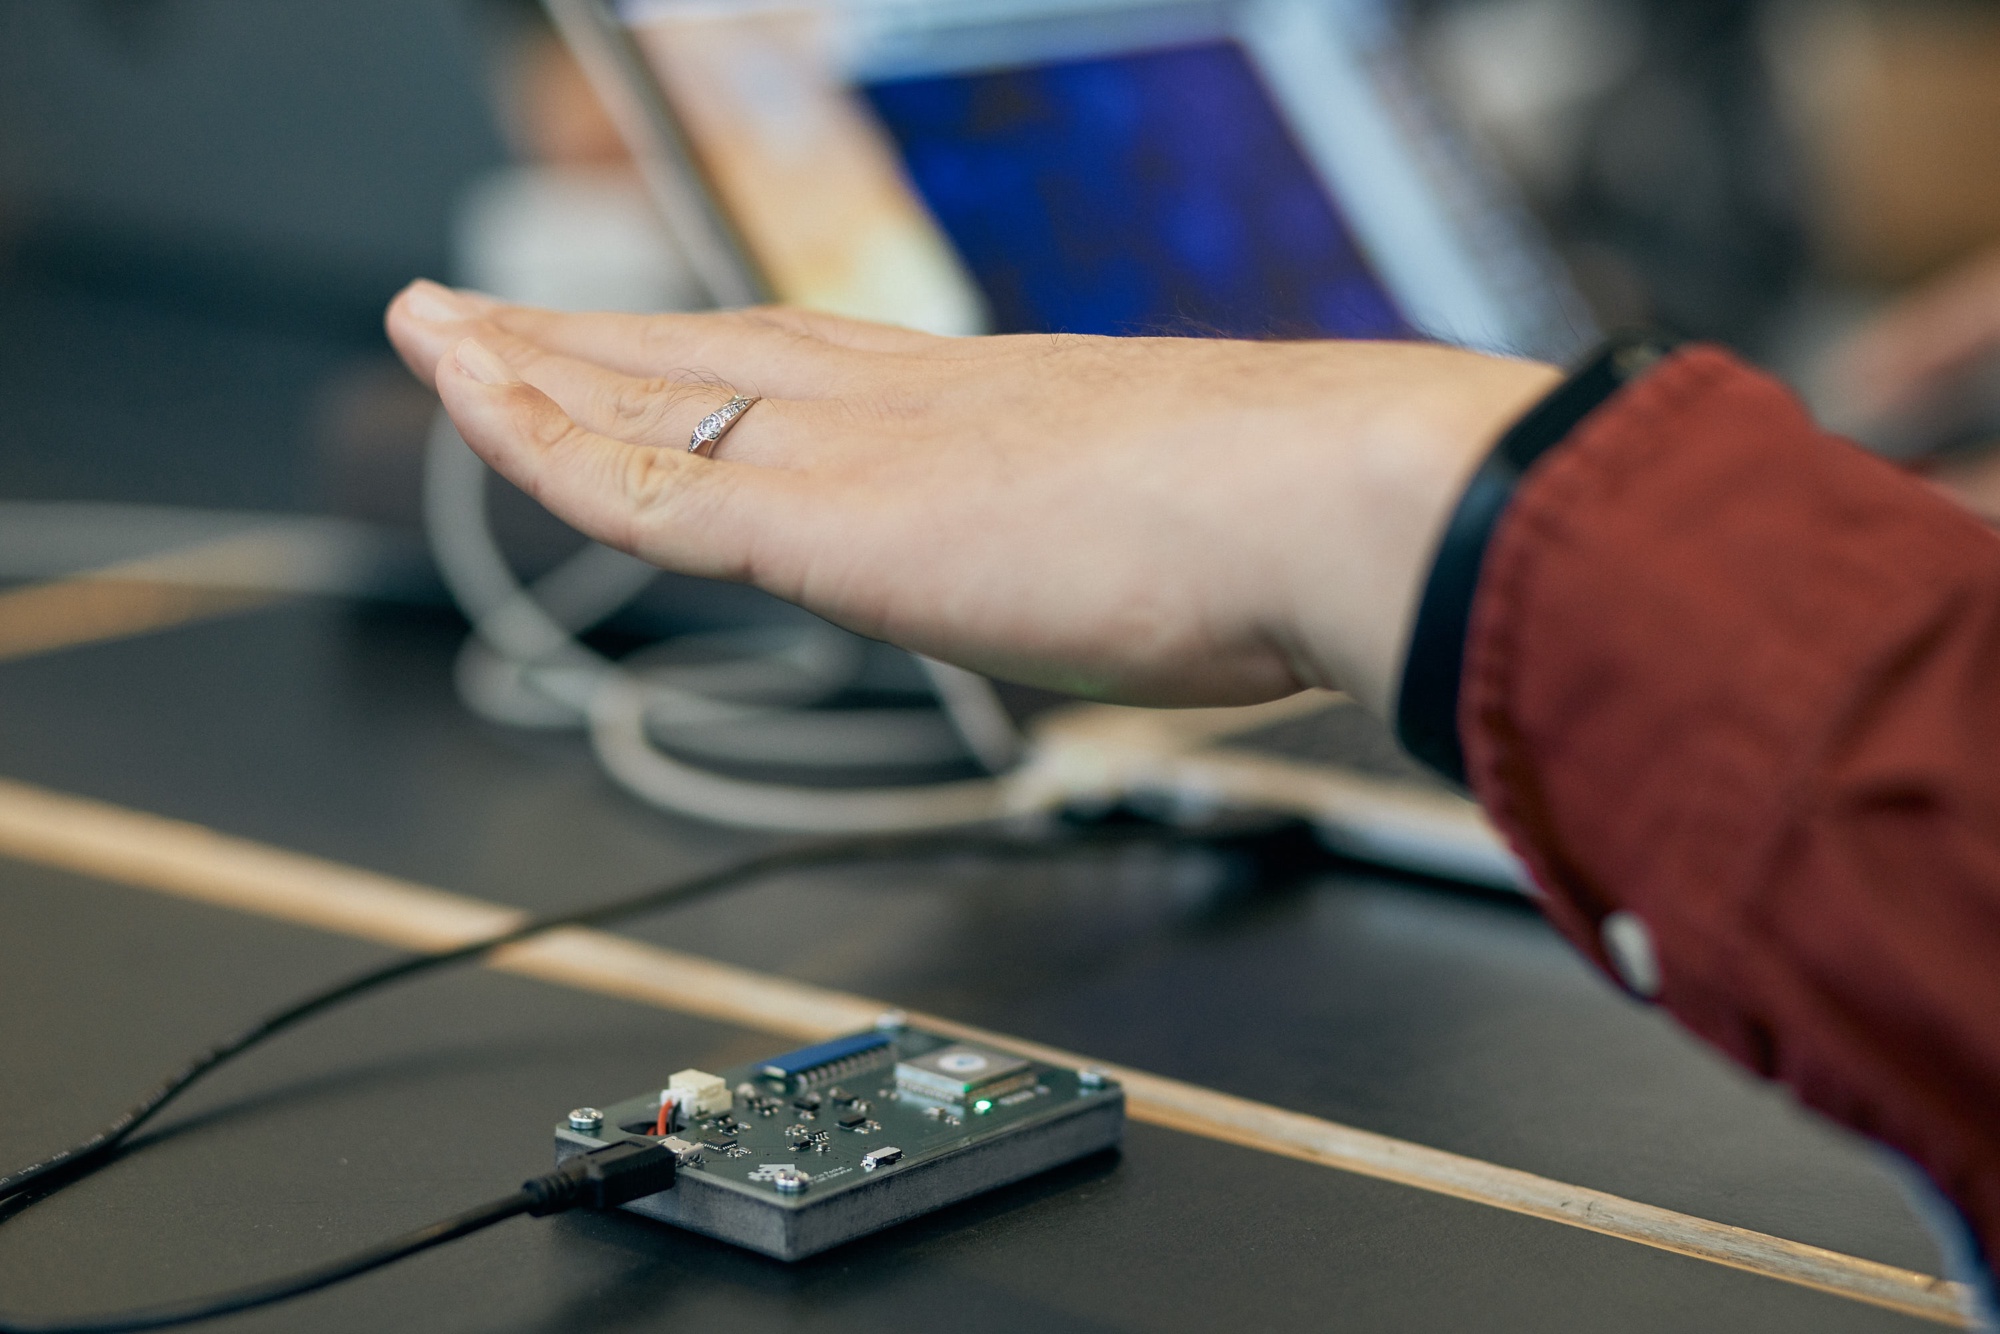
Modern technology allows data to flow rapidly between systems. For example, data from sensor networks is often available immediately to allow algorithms to efficiently optimize and control systems. As these systems get more complex over time, visualizing these real-time data flows is gaining increasing importance as a tool for understanding what’s going on. In this two-day workshop, we will look at different ways to visualize continuous streams of data. For that, we will use Processing to interpret and visualize real-time data emitted by an an electronic device. After a brief introduction to the technology kit, participants will enter an iterative design process in which they work towards a screen-based visualization to represent the gathered data. Learn and practice information design techniques for working with continuous and rapid data. The experiments are collected and shown at the exhibition accompanying the Visualizing Knowledge conference. http://vizknowledge.aalto.fi/workshops/
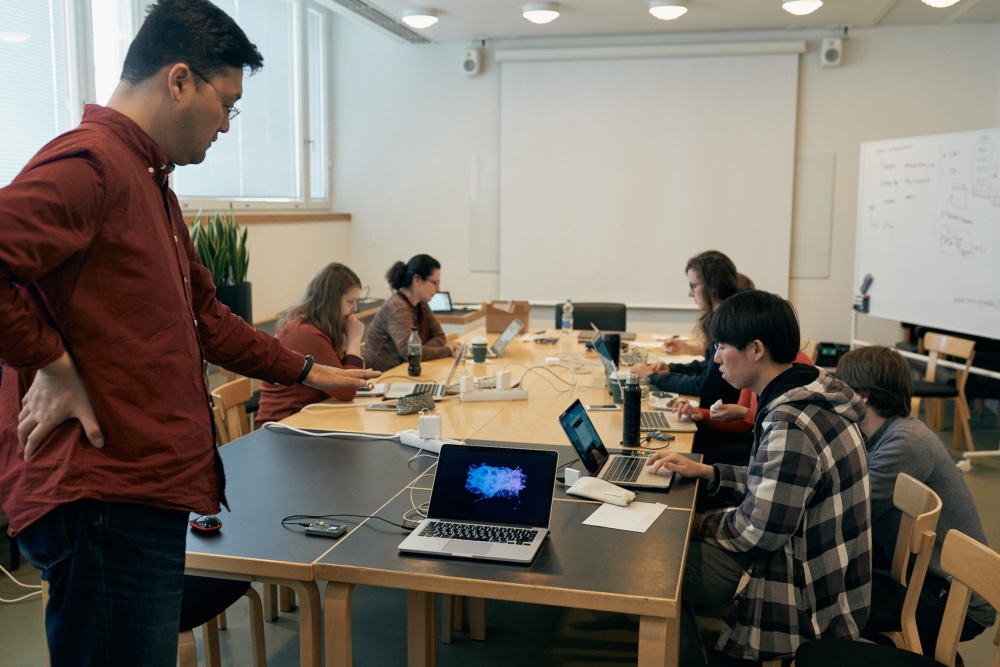
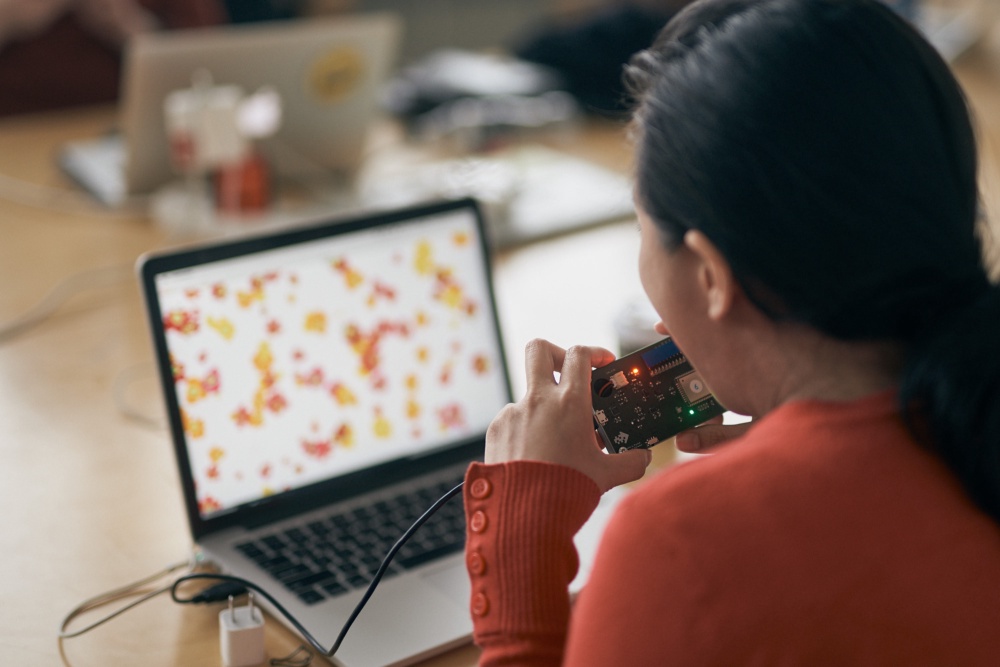
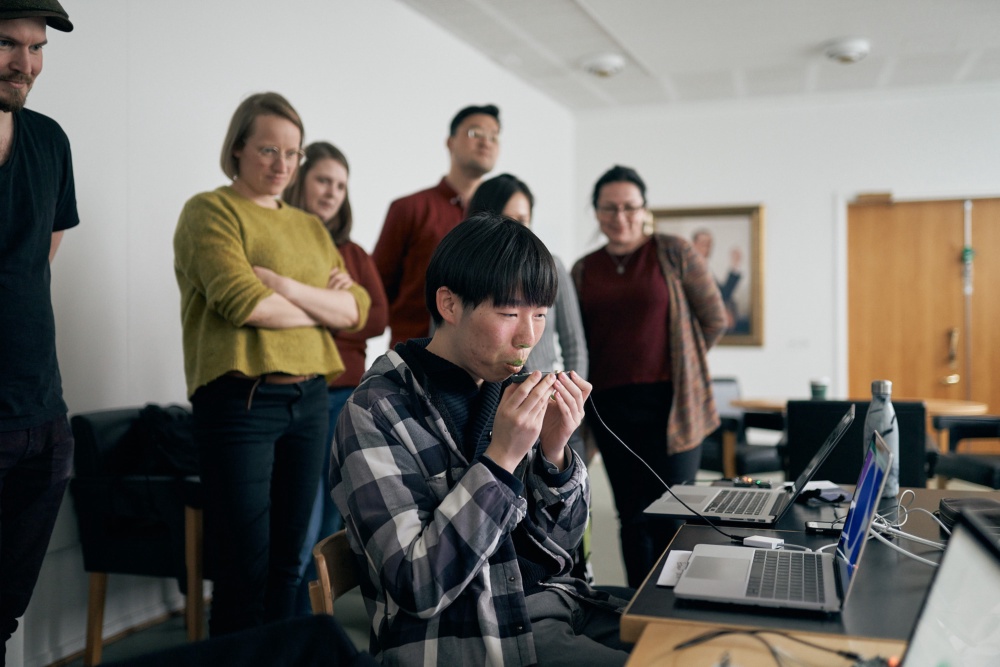
Photos by Sebastian Wolf